Visualization
Publication and poster styling
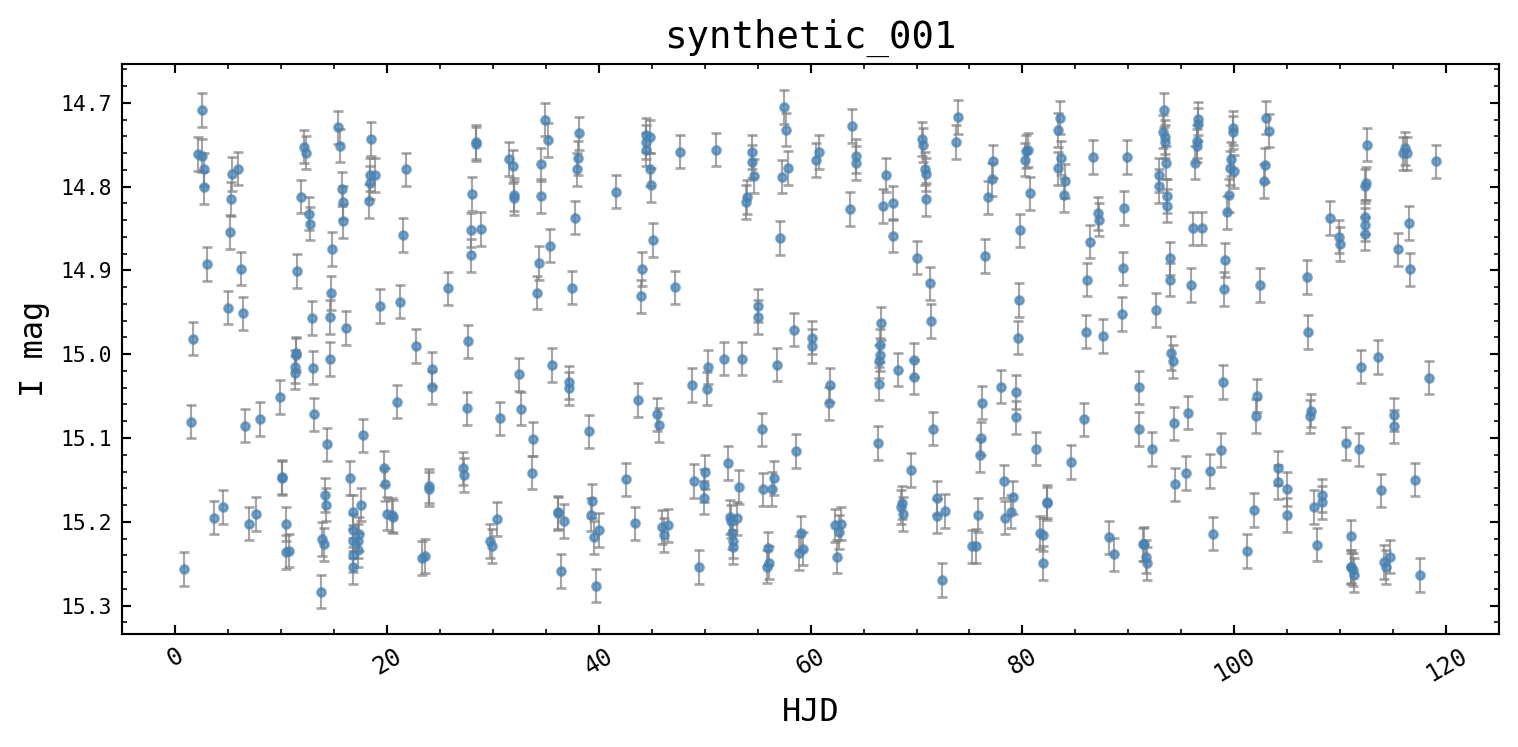
viz.style applies a consistent matplotlib theme globally, so any plot
made afterwards (including plots on other pages of this docs instance)
picks it up.
from varistar import TimeSeries, LightCurve
from varistar.viz.style import apply_science_style
from _synthetic import make_sinusoidal_lightcurve

apply_science_style()

ts = TimeSeries(magnitude="mag I", time_scale="HJD")
ts.load_data_from_df(make_sinusoidal_lightcurve(), data_id="synthetic_001")
ts.plot_timeseries()
apply_poster_style() swaps in larger fonts and thicker lines for
talks; reset_style() restores matplotlib’s defaults.
Interactive plots
viz.interactive mirrors the static plotting API with Plotly figures —
useful for docs pages where readers can zoom and hover. plotly is
already a core dependency of varistar, so no separate install is
needed (the module’s own docstring mentions pip install varistar[viz],
but that extra isn’t currently declared in pyproject.toml — worth a
quick fix on the package side, or dropping that line from the
docstring):
from varistar.viz.interactive import plot_phased

lc = LightCurve(ts)
lc.run_ls()
plot_phased(lc, period=lc.periods[0])
Next: API Reference.